The U.S. nut industry has done something Europe has not yet achieved: it has quantified itself.
With the publication of Nut Numbers, the Peanut and Tree Nut Processors Association (PTNPA) put hard economic boundaries around an industry that is often discussed only in agricultural or consumer terms. The result is not just a market overview, but a benchmark, one that highlights how structurally different the European nut market truly is.
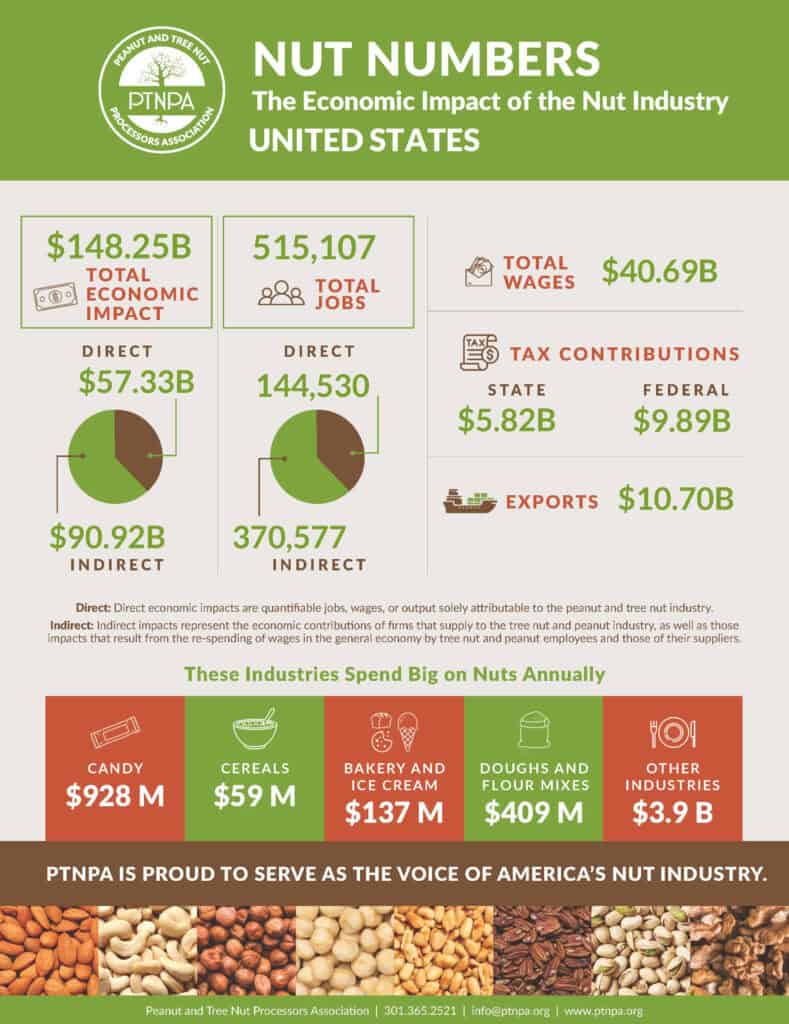
The U.S. Nut Industry in Numbers: A Fully Quantified Market
According to the PTNPA Nut Numbers report, the U.S. nut industry generates USD 148.25 billion in annual economic output, supports 515,107 jobs nationwide, and contributes USD 15.70 billion in total taxes to the U.S. economy (PTNPA).
In trade terms, the sector is equally significant. U.S. nut exports reached USD 10.69 billion annually, underlining the country’s position not just as a major consumer market, but as a global supplier of peanuts and tree nuts.
These figures reflect an industry that is vertically integrated:
large-scale domestic production
extensive processing capacity
strong export orientation
and a mature internal consumer base
Peanuts alone dominate U.S. consumption. Per-capita peanut intake reached 7.9 lbs (3.6 kg) in 2021, accounting for roughly two-thirds of total U.S. nut consumption by weight, with total nut intake estimated at ~5–6 kg per person per year (National Peanut Board).
In short, the U.S. nut market is not merely large, it is structurally self-reinforcing.
Europe: A Market of Comparable Size, but a Different Nature
Europe matches the United States in absolute relevance, but not in structure.
The European Union consumes over 2.0 million metric tons of nuts annually, including tree nuts and peanuts. Average per-capita consumption stands at ~2.1 kg per person per year in 2023, less than half the U.S. level (Market Data Forecast).
Unlike the U.S., Europe’s nut demand is tree-nut-heavy. Almonds alone account for ~0.52 million metric tons of consumption, followed by hazelnuts and walnuts at ~0.30–0.35 MMT each, with cashew kernels and pistachios each around ~0.15 MMT. Peanuts remain important, with ~0.65 MMT of net usage in 2022, but they do not dominate consumption as they do in the U.S. (CBI, United States Department of Agriculture).
This difference in product mix matters, because it shapes trade exposure.
Import Dependence vs. Production Power
The defining contrast between the two markets is supply.
Europe produces less than 10% of the nuts it consumes, making it the largest nut import market in the world, accounting for over 40% of global nut imports by volume.
In value terms, the EU imported approximately USD 7.1 billion of tree nuts in 2024, alongside substantial volumes of peanuts and processed nut products.
By category:
Almonds and pistachios are predominantly sourced from the United States
Hazelnuts are structurally dependent on Turkey (≥80% of EU supply)
Cashews are imported almost entirely as kernels, with ~72% supplied by Vietnam, followed by India and a rising share from Côte d’Ivoire
Peanuts rely heavily on Argentina, with the Netherlands acting as a major redistribution hub
The U.S., by contrast, grows surpluses of almonds, pistachios, walnuts, and peanuts domestically, exporting a significant share of production and importing mainly tropical nuts such as cashews.
This is why Europe does not, and cannot, generate “Nut Numbers” of its own on the production side.
Why This Structural Gap Matters for Cashews and Other Nuts
Europe’s reliance on imports creates cross-commodity sensitivity.
Because almonds, peanuts, cashews, pistachios, and walnuts all depend on external origins, shocks in one supply chain quickly influence others. Recent substitution effects have been documented during 2022–2023, when high prices led consumers to shift from higher-priced nuts (such as cashews and macadamias) toward cheaper alternatives like peanuts.
This dynamic means:
a strong U.S. almond crop influences European snack and ingredient pricing
Turkish hazelnut supply affects confectionery margins across the EU
changes in African or Asian cashew processing flows ripple into European demand allocation
Mercosur peanut flows indirectly affect price relationships across the entire nut complex
In the U.S., domestic production can absorb part of these shocks. In Europe, they are transmitted directly into prices, availability, and margins.
Conclusion: Two Large Markets, Two Fundamentally Different Systems
The PTNPA Nut Numbers report shows a nut industry that is economically defined, production-driven, and export-oriented.
Europe, despite comparable consumption volumes, operates as a demand-driven, import-dependent market, structurally exposed to global supply risks across all major nut categories.
With over 2.0 million metric tons of annual consumption, domestic production covering less than 10% of needs, and sourcing spread across the U.S., Turkey, Africa, South America, and Asia, the European nut market is not balanced on production, it is balanced on trade.
For stakeholders across cashews, peanuts, almonds, pistachios, hazelnuts, and walnuts, this reinforces a key reality:
European nut pricing and availability are shaped far more by global supply dynamics than by local output.

 We use cookies to ensure you get the best experience on our website. For more information, please read our